Alerts & Notifications
Configure and manage alerts to stay informed about your cluster status.
Overview
The Alerts system monitors your Kubernetes clusters and notifies you when issues occur. Access it from Monitoring > Alerting in the sidebar. The Alerting page is organized into two tabs: Notification Channels and Alert Rules.
Key features:
- Pre-configured alert templates for common scenarios
- Custom PromQL-based alert rules
- 7 notification channels (Email, Slack, Discord, Teams, Telegram, PagerDuty, Webhook)
- Alert silencing and acknowledgment
- Escalation policies (where available)
Alert Templates
SRExpert provides 10 pre-configured alert templates to get you started quickly.
Resource Alerts
| Template | Metric | Default Threshold | Duration | Severity |
|---|---|---|---|---|
| High CPU Usage | CPU utilization | > 80% | 5 min | High |
| High Memory Usage | Memory utilization | > 85% | 5 min | High |
| High Disk Usage | Disk utilization | > 85% | 10 min | High |
| Container OOM Killed | OOM events | > 0 | 1 min | Critical |
Availability Alerts
| Template | Metric | Default Threshold | Duration | Severity |
|---|---|---|---|---|
| Pod Restart Loop | Restart count | > 5 | 10 min | Critical |
| Pod Not Ready | Ready status | false | 5 min | High |
| Deployment Replicas Mismatch | Replicas delta | > 0 | 5 min | High |
Infrastructure Alerts
| Template | Metric | Default Threshold | Duration | Severity |
|---|---|---|---|---|
| Node Not Ready | Node status | != Ready | 5 min | Critical |
| PVC Storage Almost Full | PVC usage | > 80% | 10 min | High |
Application Alerts
| Template | Metric | Default Threshold | Duration | Severity |
|---|---|---|---|---|
| High HTTP Error Rate | 5xx error rate | > 5% | 5 min | Critical |
Creating Alert Rules
Using Templates
- Go to Monitoring > Alerting and open the Alert Rules tab
- Click Create Rule
- Select a template from the dropdown
- Configure:
- Target Clusters (required) - Select one or more clusters
- Namespaces (optional) - Leave empty to monitor all
- Notification Channels - Select channels to receive alerts
- Adjust threshold and duration if needed
- Click Create
Custom Rules
Create rules with custom PromQL queries:
- Go to Monitoring > Alerting and open the Alert Rules tab
- Click Create Rule
- Select Custom Rule
- Fill in the form:
Basic Information
- Rule Name - Unique identifier (e.g.,
high-memory-api) - Display Name - Human-readable name
- Description - What this alert monitors
Query Configuration
- PromQL Query - The metric query
- Operator - Comparison:
>,<,>=,<=,==,!= - Threshold - The value to compare against
Timing
- Duration - How long the condition must be true
- Options: 1m, 5m, 10m, 15m, 30m, 1h, 2h
- Severity - Alert priority level
- Critical, High, Medium, Low, Info
Scope
- Target Clusters (required) - Must have Prometheus datasource active
- Namespaces (optional) - Specific namespaces to monitor
Notifications
- Channels - Select notification channels
- Frequency - How often to re-notify
- Options: Immediate, 1m, 5m, 15m, 30m, 1h
Example: Memory Alert
Create an alert for high memory usage in production:
- Rule Name:
high-memory-production - Display Name: High Memory - Production
- Query:
container_memory_usage_bytes / container_spec_memory_limit_bytes * 100 - Operator:
> - Threshold:
90 - Duration: 5m
- Severity: High
- Clusters: production-cluster
- Namespaces: production
- Channels: slack-ops, email-team
Notification Channels
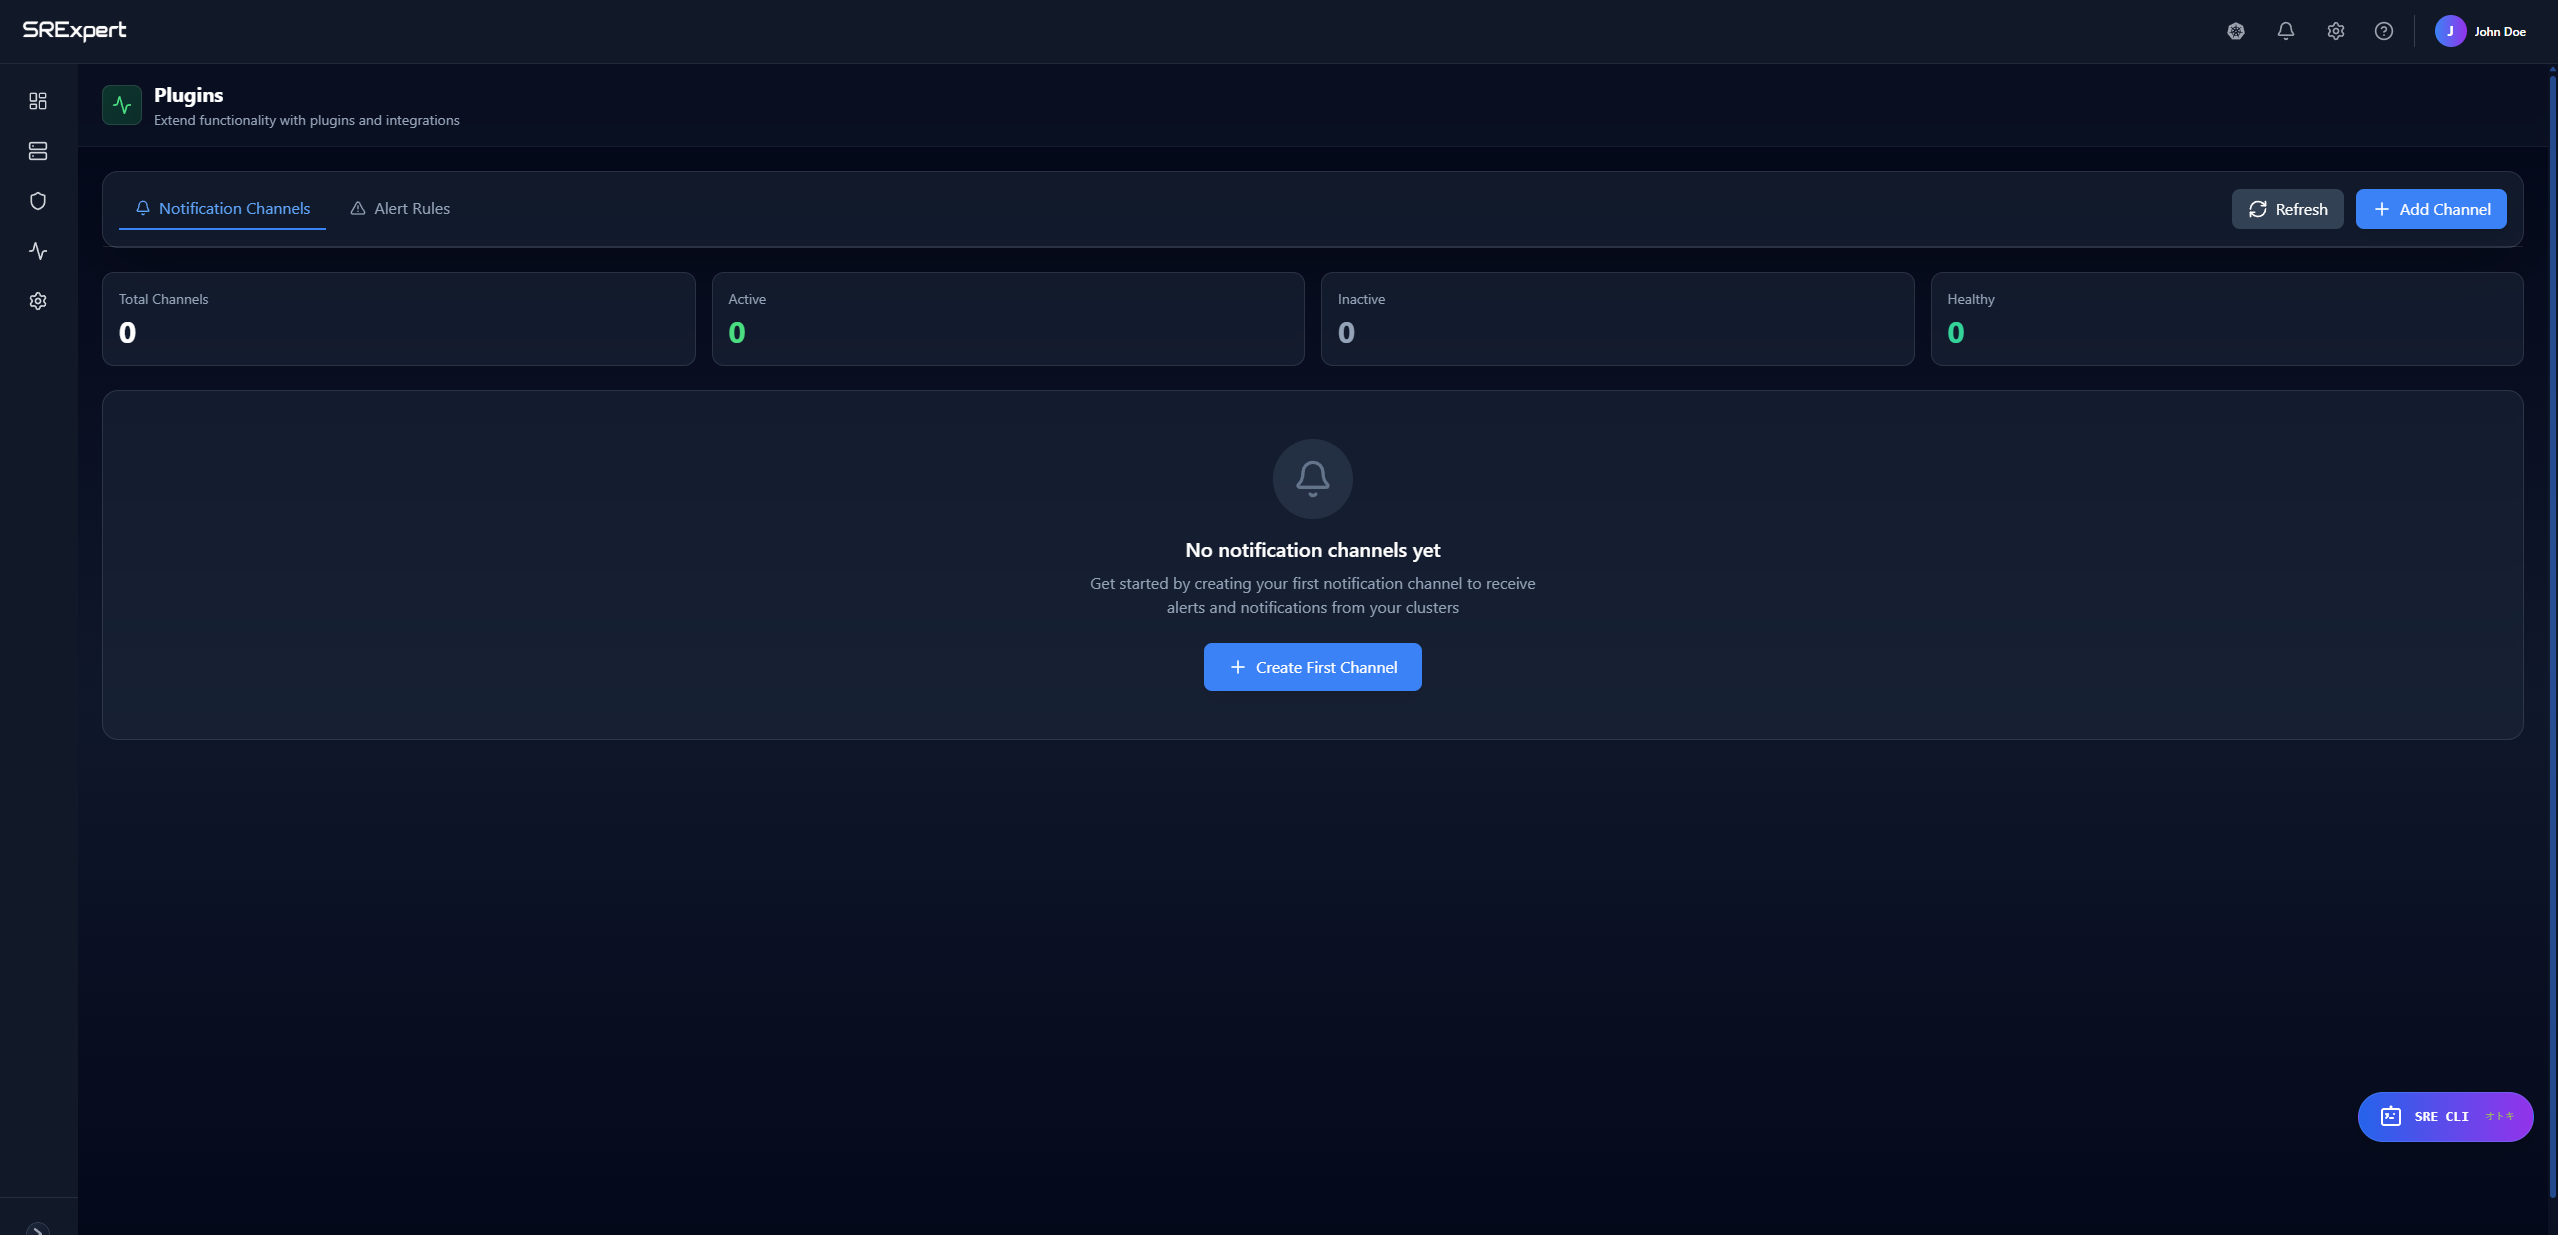
Configure channels in Monitoring > Alerting, on the Notification Channels tab. The tab shows summary counters (Total Channels, Active, Inactive, Healthy) and an Add Channel button (or Create First Channel when no channels exist yet).
Supported Channels
| Channel | Use Case | Configuration Required |
|---|---|---|
| Team notifications | SMTP server, ports, from/to addresses | |
| Slack | Real-time team alerts | Webhook URL |
| Discord | DevOps communities | Webhook URL |
| Microsoft Teams | Enterprise teams | Webhook URL |
| Telegram | Mobile notifications | Bot token, Chat ID |
| PagerDuty | On-call rotation | Integration key |
| Webhook | Custom integrations | Endpoint URL |
Creating a Channel
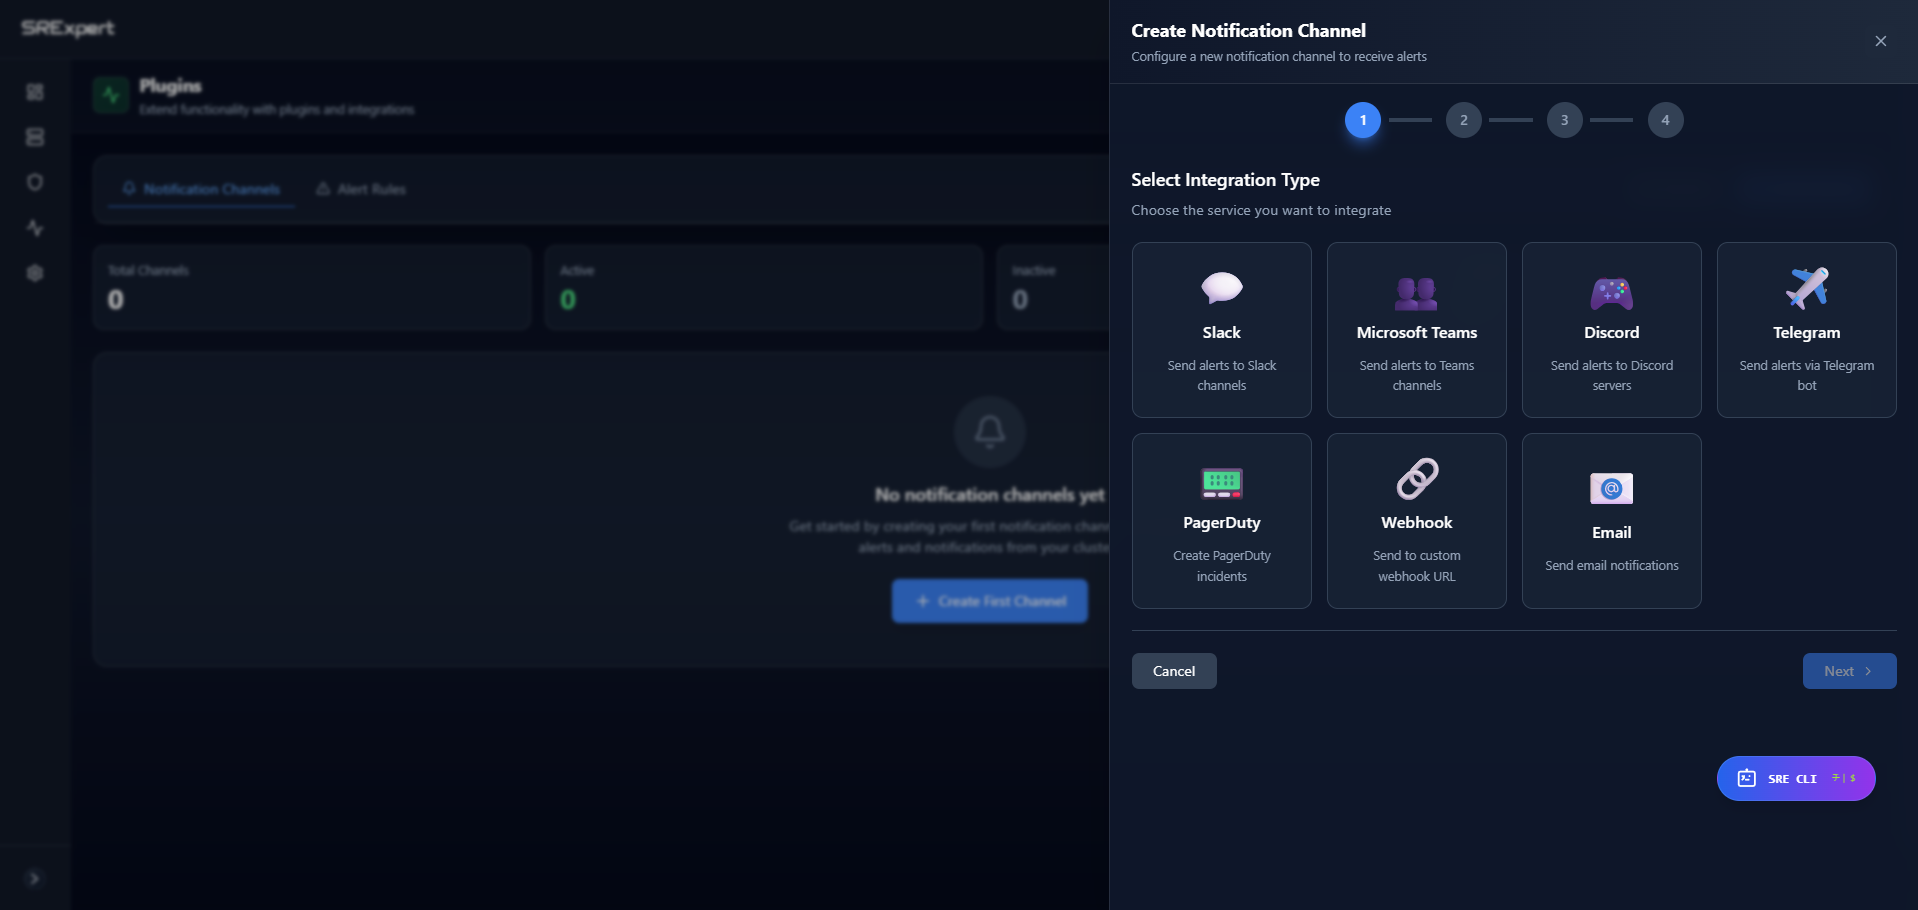
Creating a notification channel is a 4-step wizard:
- Go to Monitoring > Alerting and open the Notification Channels tab
- Click Add Channel (or Create First Channel)
- Step 1 - Select Integration Type: choose one of the 7 integration types (Slack, Microsoft Teams, Discord, Telegram, PagerDuty, Webhook, Email)
- Step 2 - Configure Connection: fill in the common fields plus the type-specific connection fields
- Internal Name - Unique identifier (no spaces)
- Display Name - Friendly, human-readable name
- Description - What this channel is for
- Type-specific fields (e.g. Webhook URL for Slack, SMTP settings for Email)
- Step 3 and Step 4: continue with the remaining configuration (such as alert filters and delivery options, where available) and review your settings
- Finish the wizard to create the channel, then use Send Test from the channel’s actions menu to verify it
For step-by-step, per-integration instructions, see Notification Plugins.
Slack Configuration
- Create a Slack Webhook:
- Go to your Slack workspace settings
- Create an Incoming Webhook
- Copy the Webhook URL
- In SRExpert:
- Add Channel > Slack
- Paste the Webhook URL
- Test and save
Slack messages include:
- Alert severity with color coding
- Rule name and description
- Affected cluster and namespace
- Current metric value
- Timestamp
Email Configuration
Email channels use per-channel SMTP settings, configured in Step 2 of the wizard:
- SMTP Server - Your mail server host
- SMTP Port - Usually 587 (TLS) or 465 (SSL)
- From Email - Sender address
- To Email - Recipient address
- Username (optional) - SMTP username
- Password (optional) - SMTP password
PagerDuty Configuration
- In PagerDuty, create an Events API v2 integration
- Copy the Integration Key
- In SRExpert, add the key
Severity mapping:
- Critical → critical
- High → error
- Medium → warning
- Low/Info → info
Webhook Configuration
Send alerts to any HTTP endpoint:
- URL - Your endpoint (POST requests)
- Headers (optional) - Custom headers
Payload format:
{
  "alert_id": "uuid",
  "rule_name": "high-cpu-usage",
  "severity": "high",
  "status": "firing",
  "cluster_name": "production",
  "namespace": "default",
  "current_value": 85.5,
  "threshold_value": 80,
  "message": "CPU usage is at 85.5%",
  "fired_at": "2024-01-15T10:30:00Z"
}
The exact payload fields may evolve over time. Build integrations defensively and avoid assuming a fixed set of keys.
Managing Alerts
Alert States
| State | Description | Actions |
|---|---|---|
| Firing | Condition is currently met | Acknowledge, Silence |
| Pending | Condition met, waiting for duration | - |
| Resolved | Condition no longer met | - |
| Acknowledged | Someone is handling it | Resolve |
| Silenced | Temporarily muted | Unsilence |
Acknowledging Alerts
When you start investigating an alert:
- Go to Monitoring > Alerting (Alert Rules tab) or the dashboard
- Find the firing alert
- Click Acknowledge
This:
- Stops repeat notifications
- Records who acknowledged and when
- May track response-time metrics (where available)
Silencing Alerts
Silencing lets you temporarily mute alerts during maintenance. From the Alerting view, you can create a silence and configure:
- Duration - How long to silence
- Matchers - Which alerts to silence (by name, cluster, namespace)
- Comment - Why it’s silenced
Use cases:
- Planned maintenance windows
- Known issues being fixed
- Noisy alerts under investigation
Testing Alert Rules
Before enabling, test your rule:
- Find the rule in Alert Rules
- Click the menu (⋮) > Test
- The system will:
- Execute the PromQL query
- Check if it would fire
- Show you the result
Alert Dashboard
The dashboard at Monitoring > Alerting (Alert Rules tab) shows:
Overview Cards
- Active Alerts - Currently firing
- Critical - Critical severity count
- High - High severity count
- Recent - Fired in last hour
Alert List
- Status icon (firing, resolved, etc.)
- Severity badge with color
- Rule name and display name
- Affected cluster and namespace
- Current value vs threshold
- Time since firing
- Quick actions (Acknowledge, Silence, Resolve)
Filtering
Filter alerts by:
- Status (Firing, Resolved, Acknowledged, Silenced)
- Severity (Critical, High, Medium, Low, Info)
- Cluster
- Namespace
- Time range
Alert Rule Actions
From the rule card menu:
| Action | Description |
|---|---|
| Edit | Modify rule configuration |
| Test | Test rule execution |
| Pause | Temporarily disable evaluation |
| Resume | Re-enable paused rule |
| Delete | Remove rule permanently |
Severity Guidelines
| Severity | Response | Example |
|---|---|---|
| Critical | Immediate action required | Node down, pod crash loop |
| High | Action within hours | High memory, failing pods |
| Medium | Action within a day | Resource approaching limit |
| Low | Review when convenient | Minor configuration issue |
| Info | Informational only | Certificate expiring soon |
Best Practices
Alert Design
- Be specific - Target specific namespaces when possible
- Set appropriate durations - Avoid flapping with short durations
- Use severity correctly - Reserve Critical for truly urgent issues
- Add descriptions - Help on-call engineers understand the alert
- Test before enabling - Use the test feature
Channel Configuration
- Route by severity - Critical to PagerDuty, Info to Slack
- Limit noise - Use filters and any available rate-limiting options to prevent alert storms
- Set up redundancy - Have backup channels
- Test regularly - Verify channels still work
Reducing Alert Fatigue
- Review noisy alerts - Tune thresholds or disable
- Combine related alerts - One alert for related issues
- Use silencing - During known maintenance
- Document runbooks - So alerts lead to action
Alert History
View past alerts:
- Go to Monitoring > Alerting (Alert Rules tab)
- Select an alert to see its history
- Information includes:
- When it fired
- When it resolved
- Who acknowledged
- Duration
Historical alerts may be retained for a limited period before automatic cleanup.
Next Steps
- Monitoring View - View metrics and dashboards
- Security View - Security-related alerts
- SRE CLI - Ask about alerts using AI