Data Sources
Data Sources are the foundation of monitoring in SRExpert. They connect your monitoring backends (like Prometheus) to the platform, enabling metrics visualization, alerting, and observability features.
Prerequisites: Before configuring a Data Source, you need to have Prometheus installed in your cluster. You can easily install it using the Helm Charts feature in SRExpert - just search for kube-prometheus-stack and click Install.
Overview
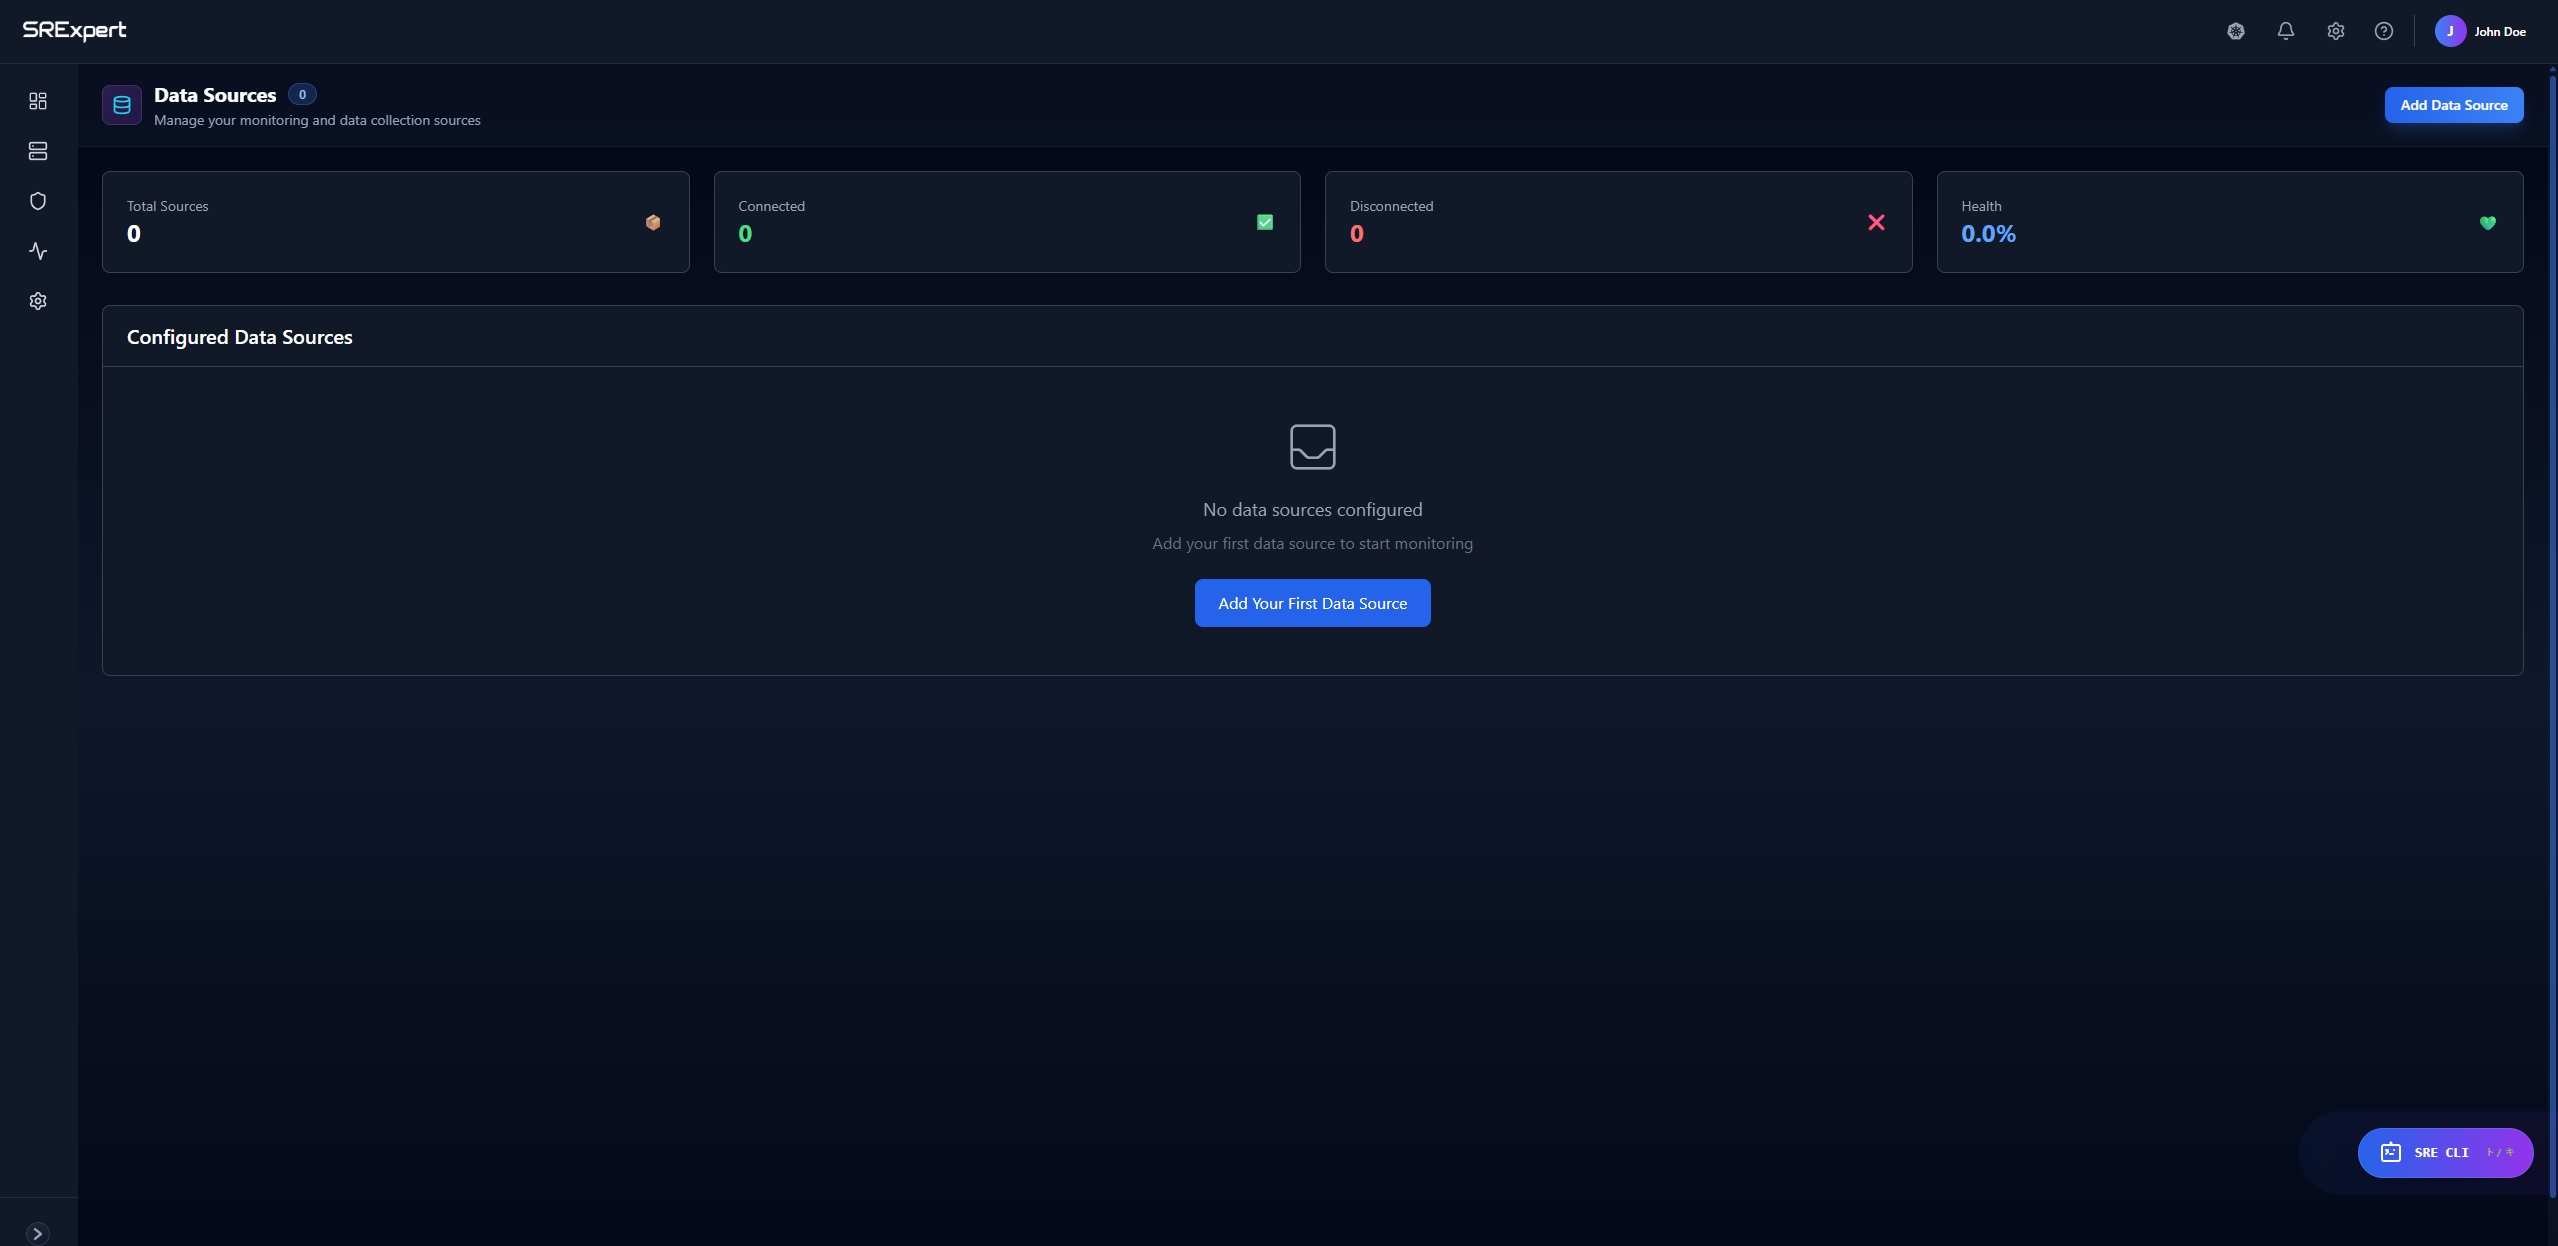
The Data Sources page displays:
- Total Sources: Number of configured data sources
- Connected: Data sources with successful connections
- Disconnected: Data sources with connection issues
- Health: Overall health percentage of your data sources
Adding a Data Source
Step 1: Click Add Data Source
Click the “Add Data Source” button in the top right corner, or “Add Your First Data Source” if you haven’t configured any yet.
Step 2: Configure the Connection
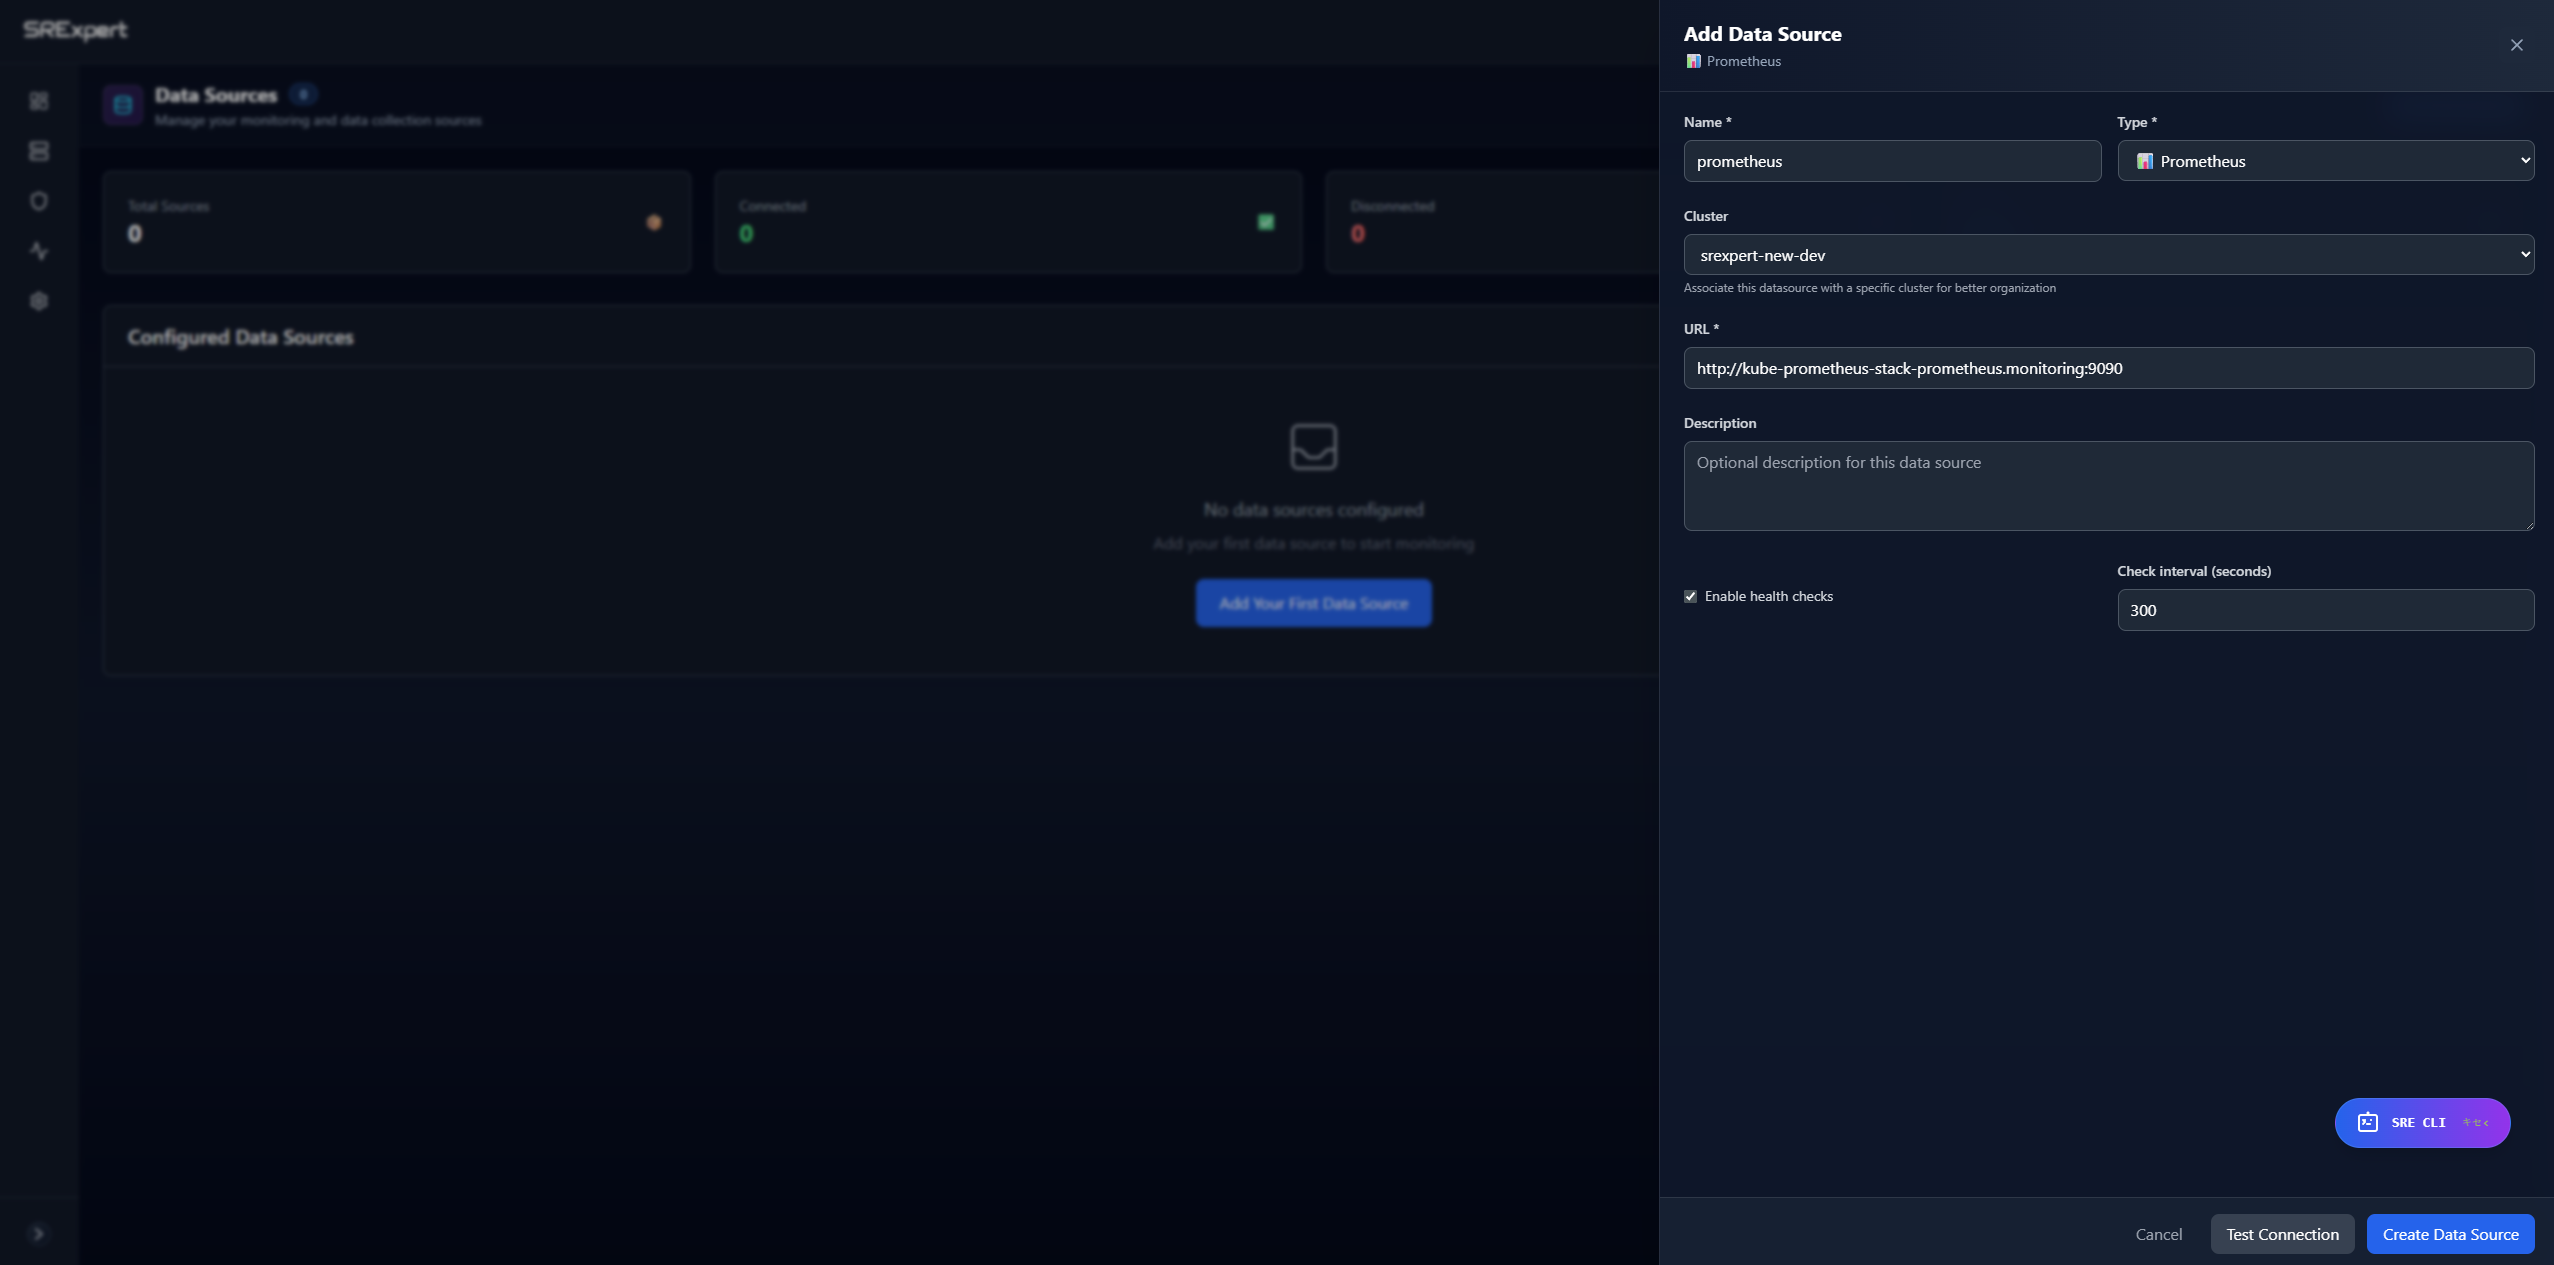
Fill in the required fields:
| Field | Description | Example |
|---|---|---|
| Name | A friendly name for your data source | Production Prometheus |
| Type | The type of data source | Prometheus |
| URL | The endpoint URL of your data source | http://prometheus.monitoring:9090 |
Understanding the URL Format
The URL format for Kubernetes services follows this pattern:
http://<service-name>.<namespace>:<port>How to find each component:
- Service Name: Run
kubectl get svc -n <namespace>to list services - Namespace: The Kubernetes namespace where Prometheus is deployed (commonly
monitoring) - Port: The service port (default for Prometheus is
9090)
Common examples:
# Prometheus Operator / kube-prometheus-stack
http://kube-prometheus-stack-prometheus.monitoring:9090

# Standalone Prometheus
http://prometheus-server.monitoring:9090

# Custom installation
http://my-prometheus.observability:9090
Finding the correct URL via kubectl:
# List services in the monitoring namespace
kubectl get svc -n monitoring

# Example output:
# NAME                                  TYPE        CLUSTER-IP      PORT(S)
# kube-prometheus-stack-prometheus      ClusterIP   10.96.100.50    9090/TCP

# Your URL would be:
# http://kube-prometheus-stack-prometheus.monitoring:9090
Step 3: Test the Connection
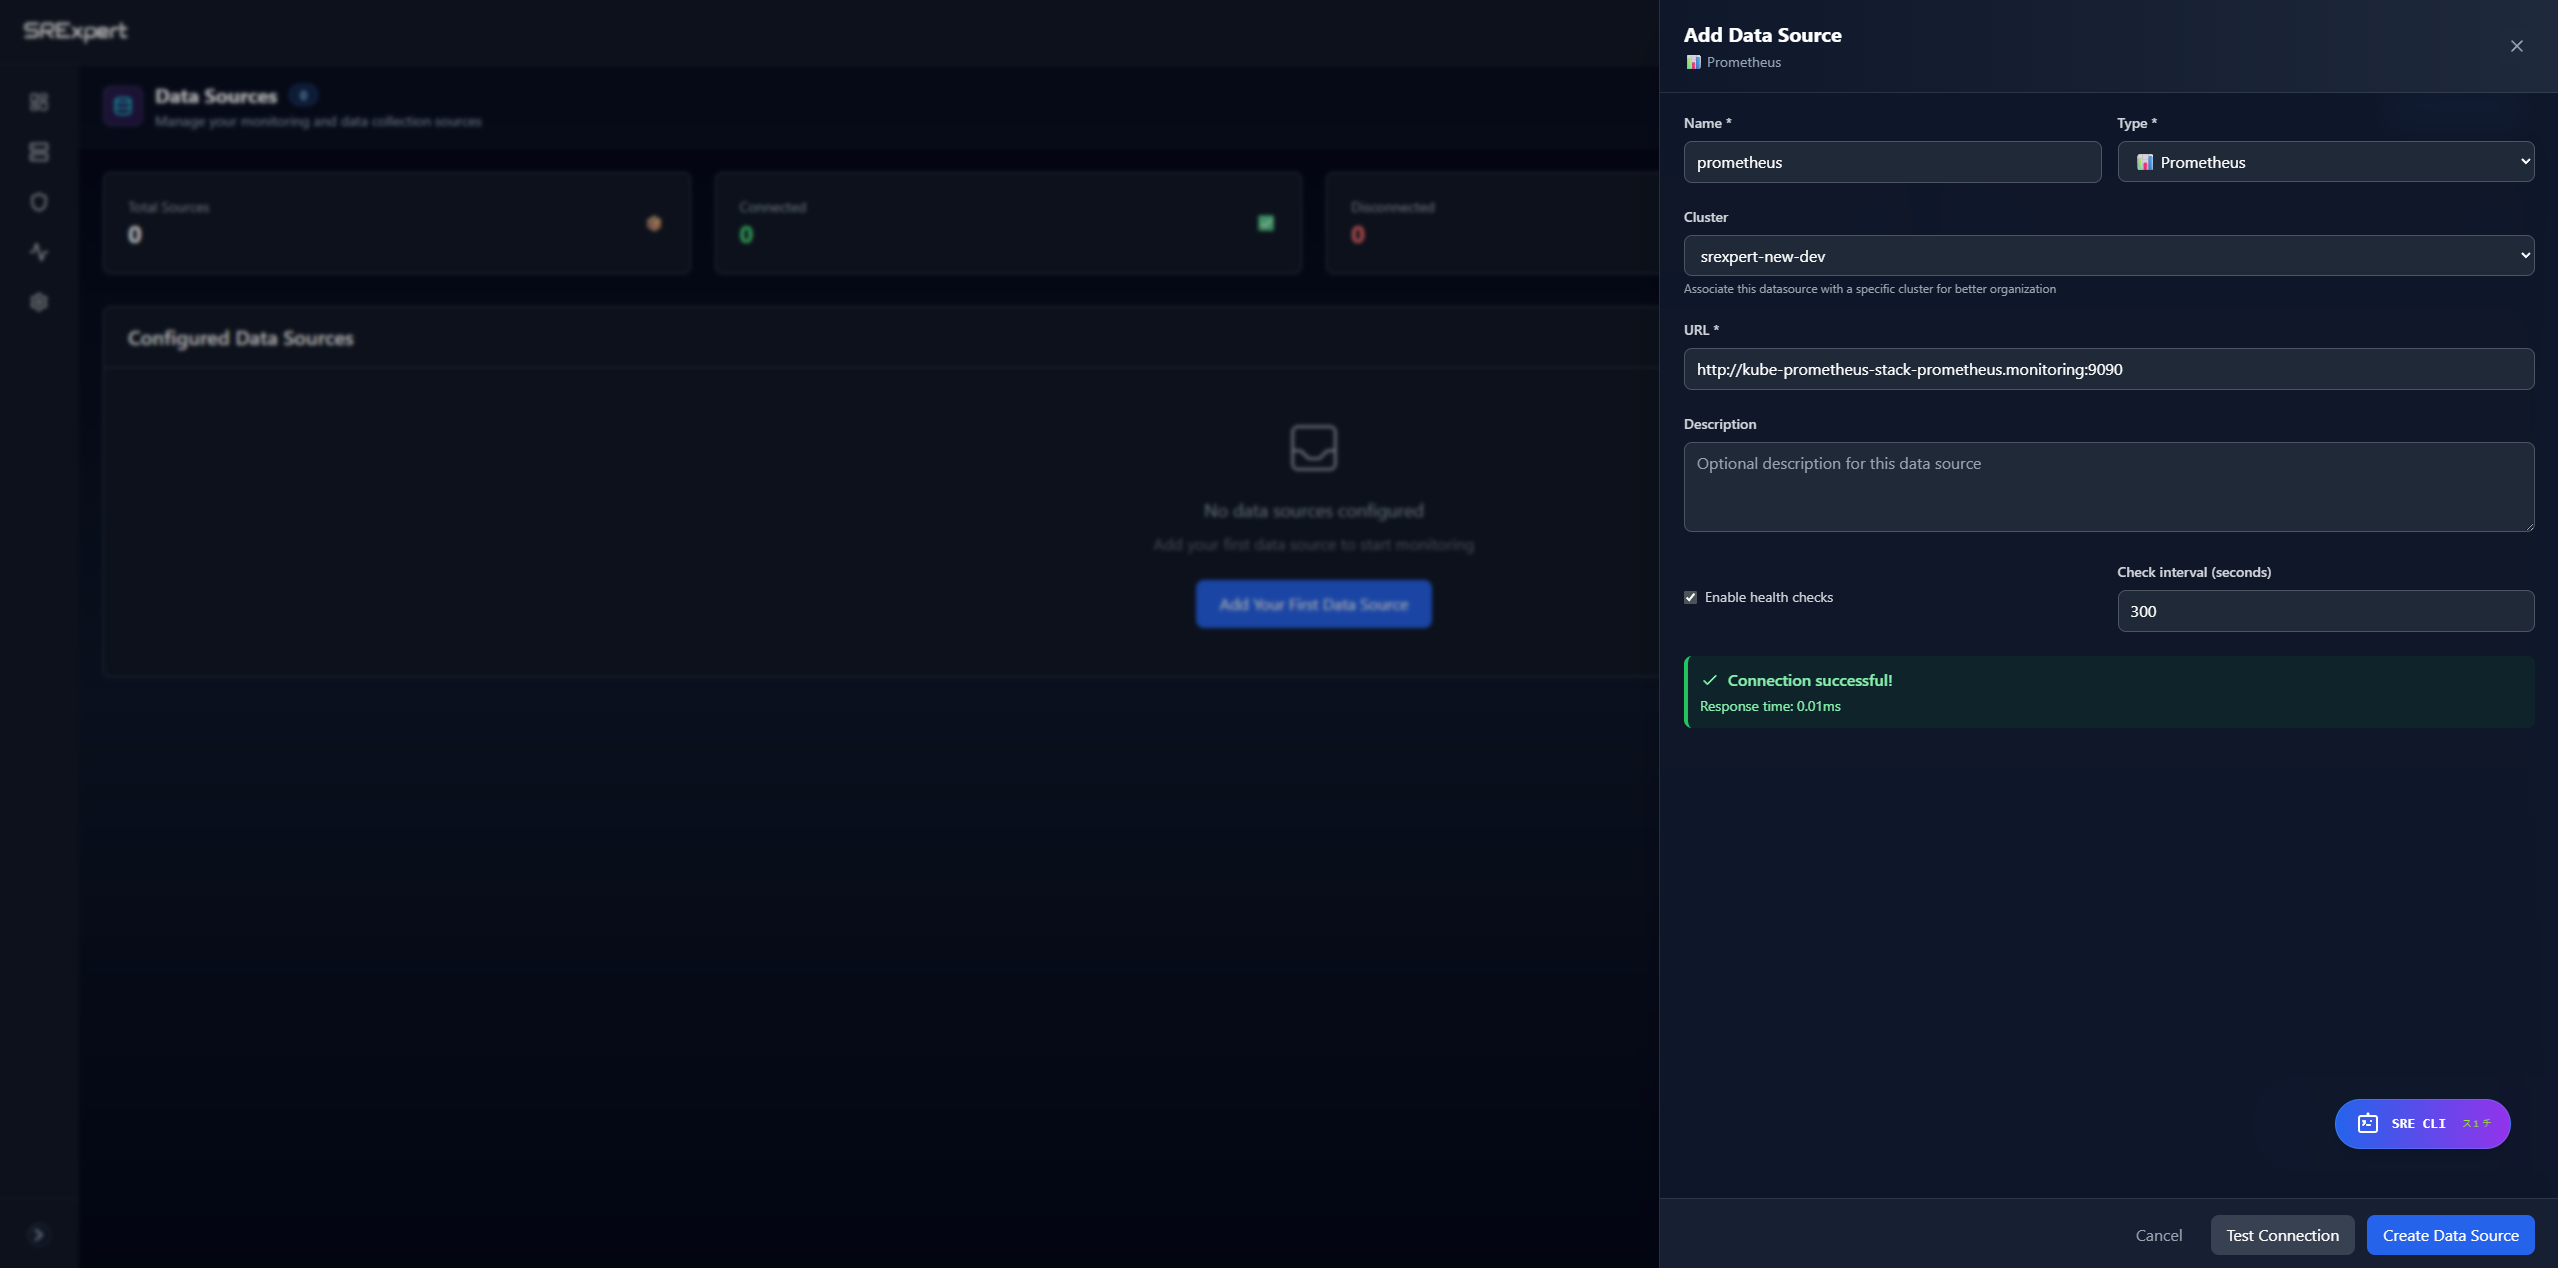
Before saving, always click “Test Connection” to verify:
- ✅ Connection successful! - Your configuration is correct
- ❌ Connection failed - Check your URL, network policies, and service availability
Common connection issues:
| Error | Possible Cause | Solution |
|---|---|---|
| Connection refused | Wrong port or service not running | Verify port and check if Prometheus pod is running |
| Host not found | Wrong service name or namespace | Double-check service name and namespace |
| Timeout | Network policy blocking traffic | Check NetworkPolicies in your cluster |
| 401 Unauthorized | Authentication required | Configure authentication settings |
Step 4: Save and Verify
After a successful connection test, click “Save” to add the data source.
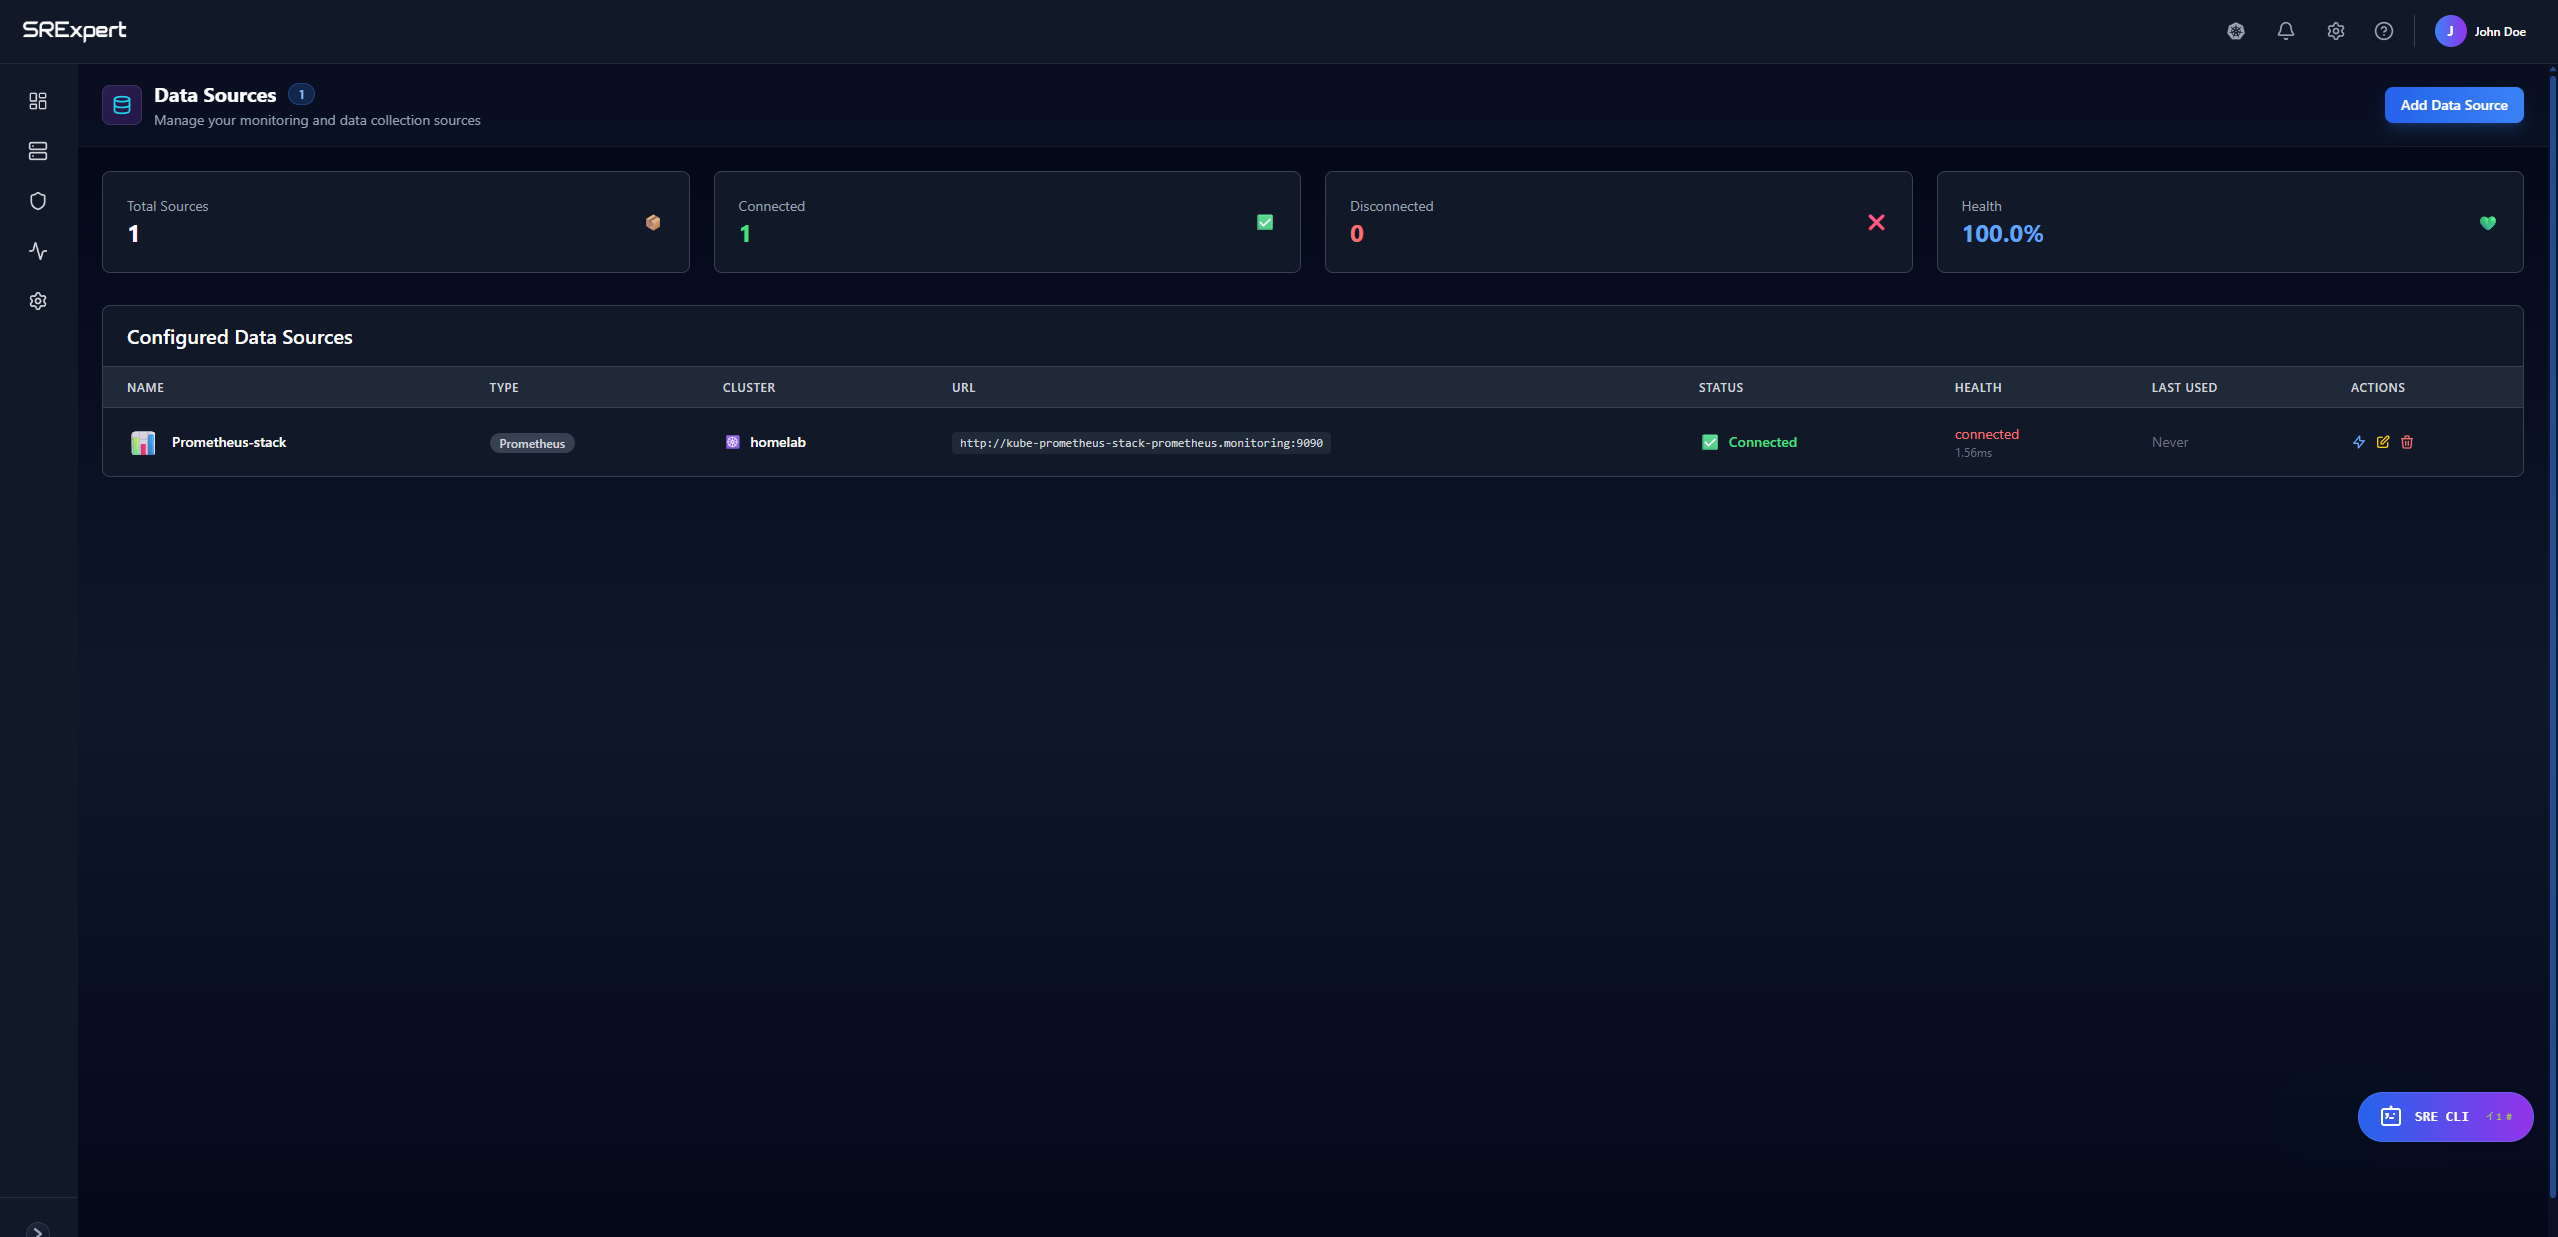
Your data source will now appear in the list with its connection status.
Managing Data Sources
Editing a Data Source
- Click on the data source name in the list
- Modify the configuration
- Test the connection
- Save changes
Deleting a Data Source
- Click the three dots menu (⋮) on the data source row
- Select Delete
- Confirm the deletion
Warning: Deleting a data source will remove all associated dashboards and alerts that depend on it.
Supported Data Sources
Currently, SRExpert supports:
| Data Source | Description |
|---|---|
| Prometheus | Time-series database for metrics |
Coming soon:
- Grafana
- InfluxDB
- Datadog
- And more…
Best Practices
-
Use descriptive names: Name your data sources clearly (e.g.,
prod-cluster-prometheus,staging-metrics) -
Test before saving: Always verify the connection before saving
-
Monitor health: Regularly check the Data Sources page for connection issues
-
Use internal DNS: When possible, use Kubernetes internal DNS (
service.namespace:port) instead of external URLs
Troubleshooting
Cannot connect to Prometheus
-
Verify Prometheus is running:
kubectl get pods -n monitoring -l app=prometheus -
Check the service exists:
kubectl get svc -n monitoring | grep prometheus -
Test connectivity from another pod:
kubectl run curl-test --image=curlimages/curl -it --rm -- \
  curl http://prometheus.monitoring:9090/-/healthy
Connection drops intermittently
- Check if Prometheus pods are being restarted
- Verify resource limits on Prometheus
- Check for network policy changes
Next Steps
- Monitoring Overview - View your cluster metrics
- Alerts & Notifications - Set up alerting based on metrics
- Custom Dashboards - Create custom metric dashboards