Dashboard View
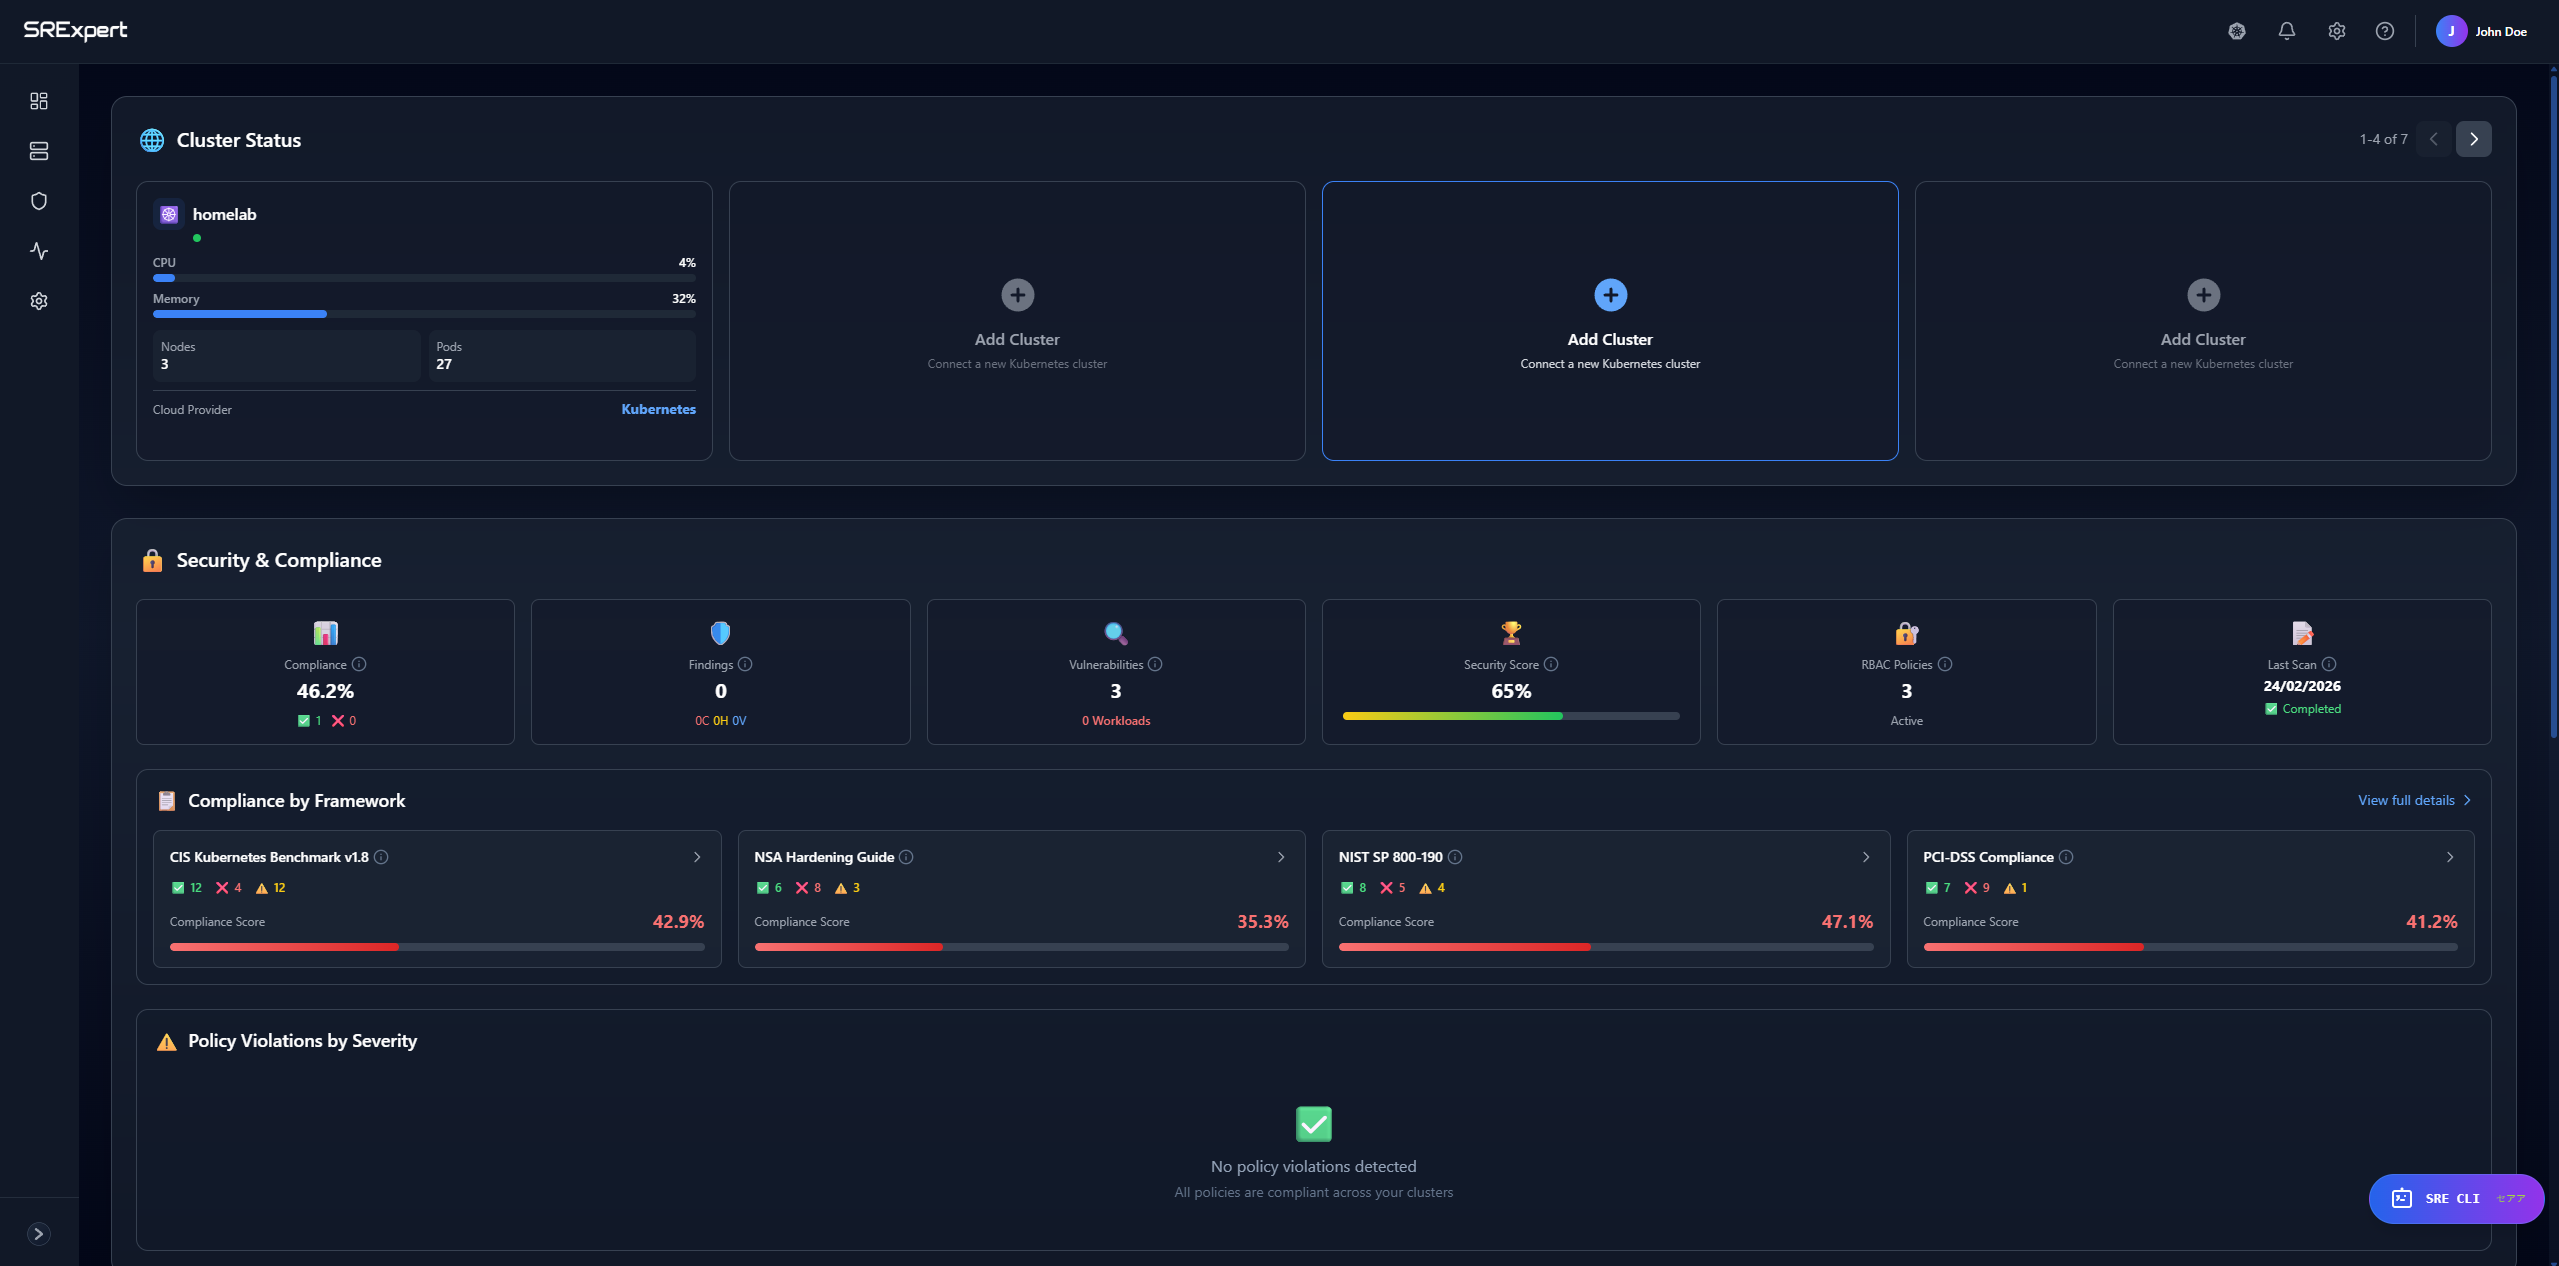
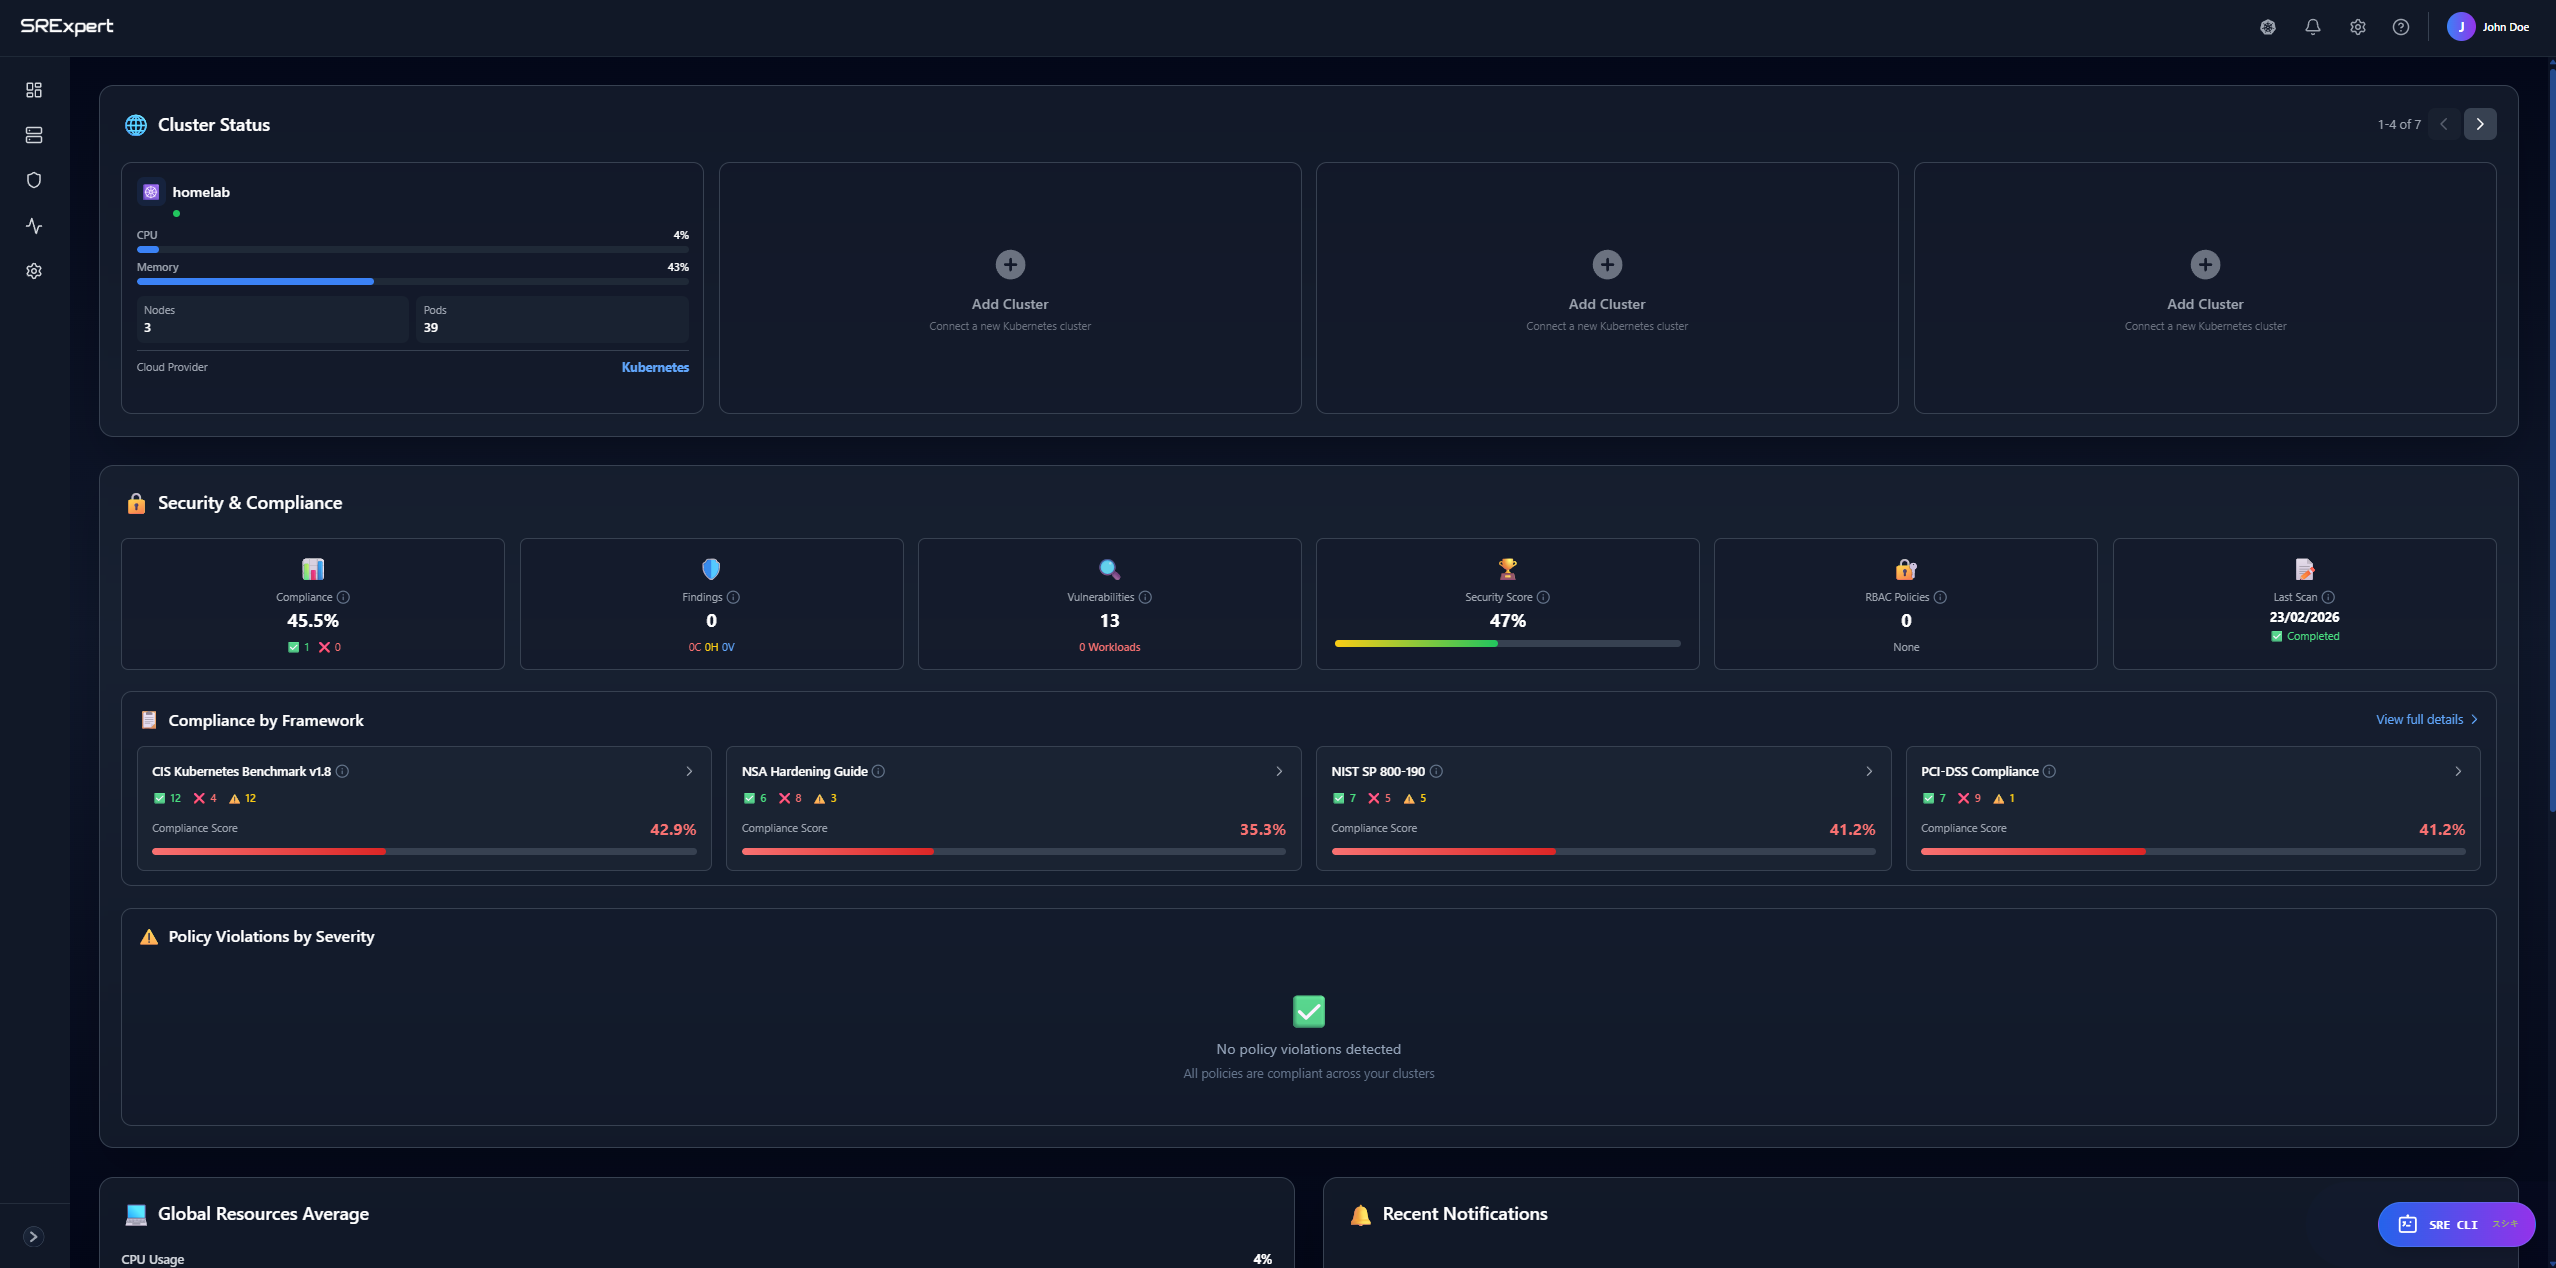
The Dashboard provides a comprehensive overview of your cluster’s health and status.
Overview
The main dashboard displays:
- Cluster health indicators
- Resource utilization
- Workload status
- Recent events
- Quick actions
Cluster Health
Health Indicators
| Indicator | Description |
|---|---|
| Healthy | All components functioning normally |
| Warning | Some issues detected |
| Critical | Immediate attention required |
Components Monitored
- API Server
- etcd
- Scheduler
- Controller Manager
- Node status
Resource Utilization
CPU Usage
- Current cluster-wide CPU usage
- CPU requests vs limits
- Per-node breakdown
Memory Usage
- Current memory utilization
- Memory pressure status
- Per-node breakdown
Storage
- Persistent Volume status
- Storage class usage
- Volume claims
Workload Summary
Quick view of workload status:
| Resource | Shows |
|---|---|
| Pods | Running / Total |
| Deployments | Ready / Total |
| Services | Count |
| Ingresses | Count |
Pod Status Breakdown
- Running
- Pending
- Failed
- Succeeded
- Unknown
Namespace Overview
See resource distribution across namespaces:
- Resource counts per namespace
- CPU/Memory usage per namespace
- Quick navigation to namespace details
Recent Events
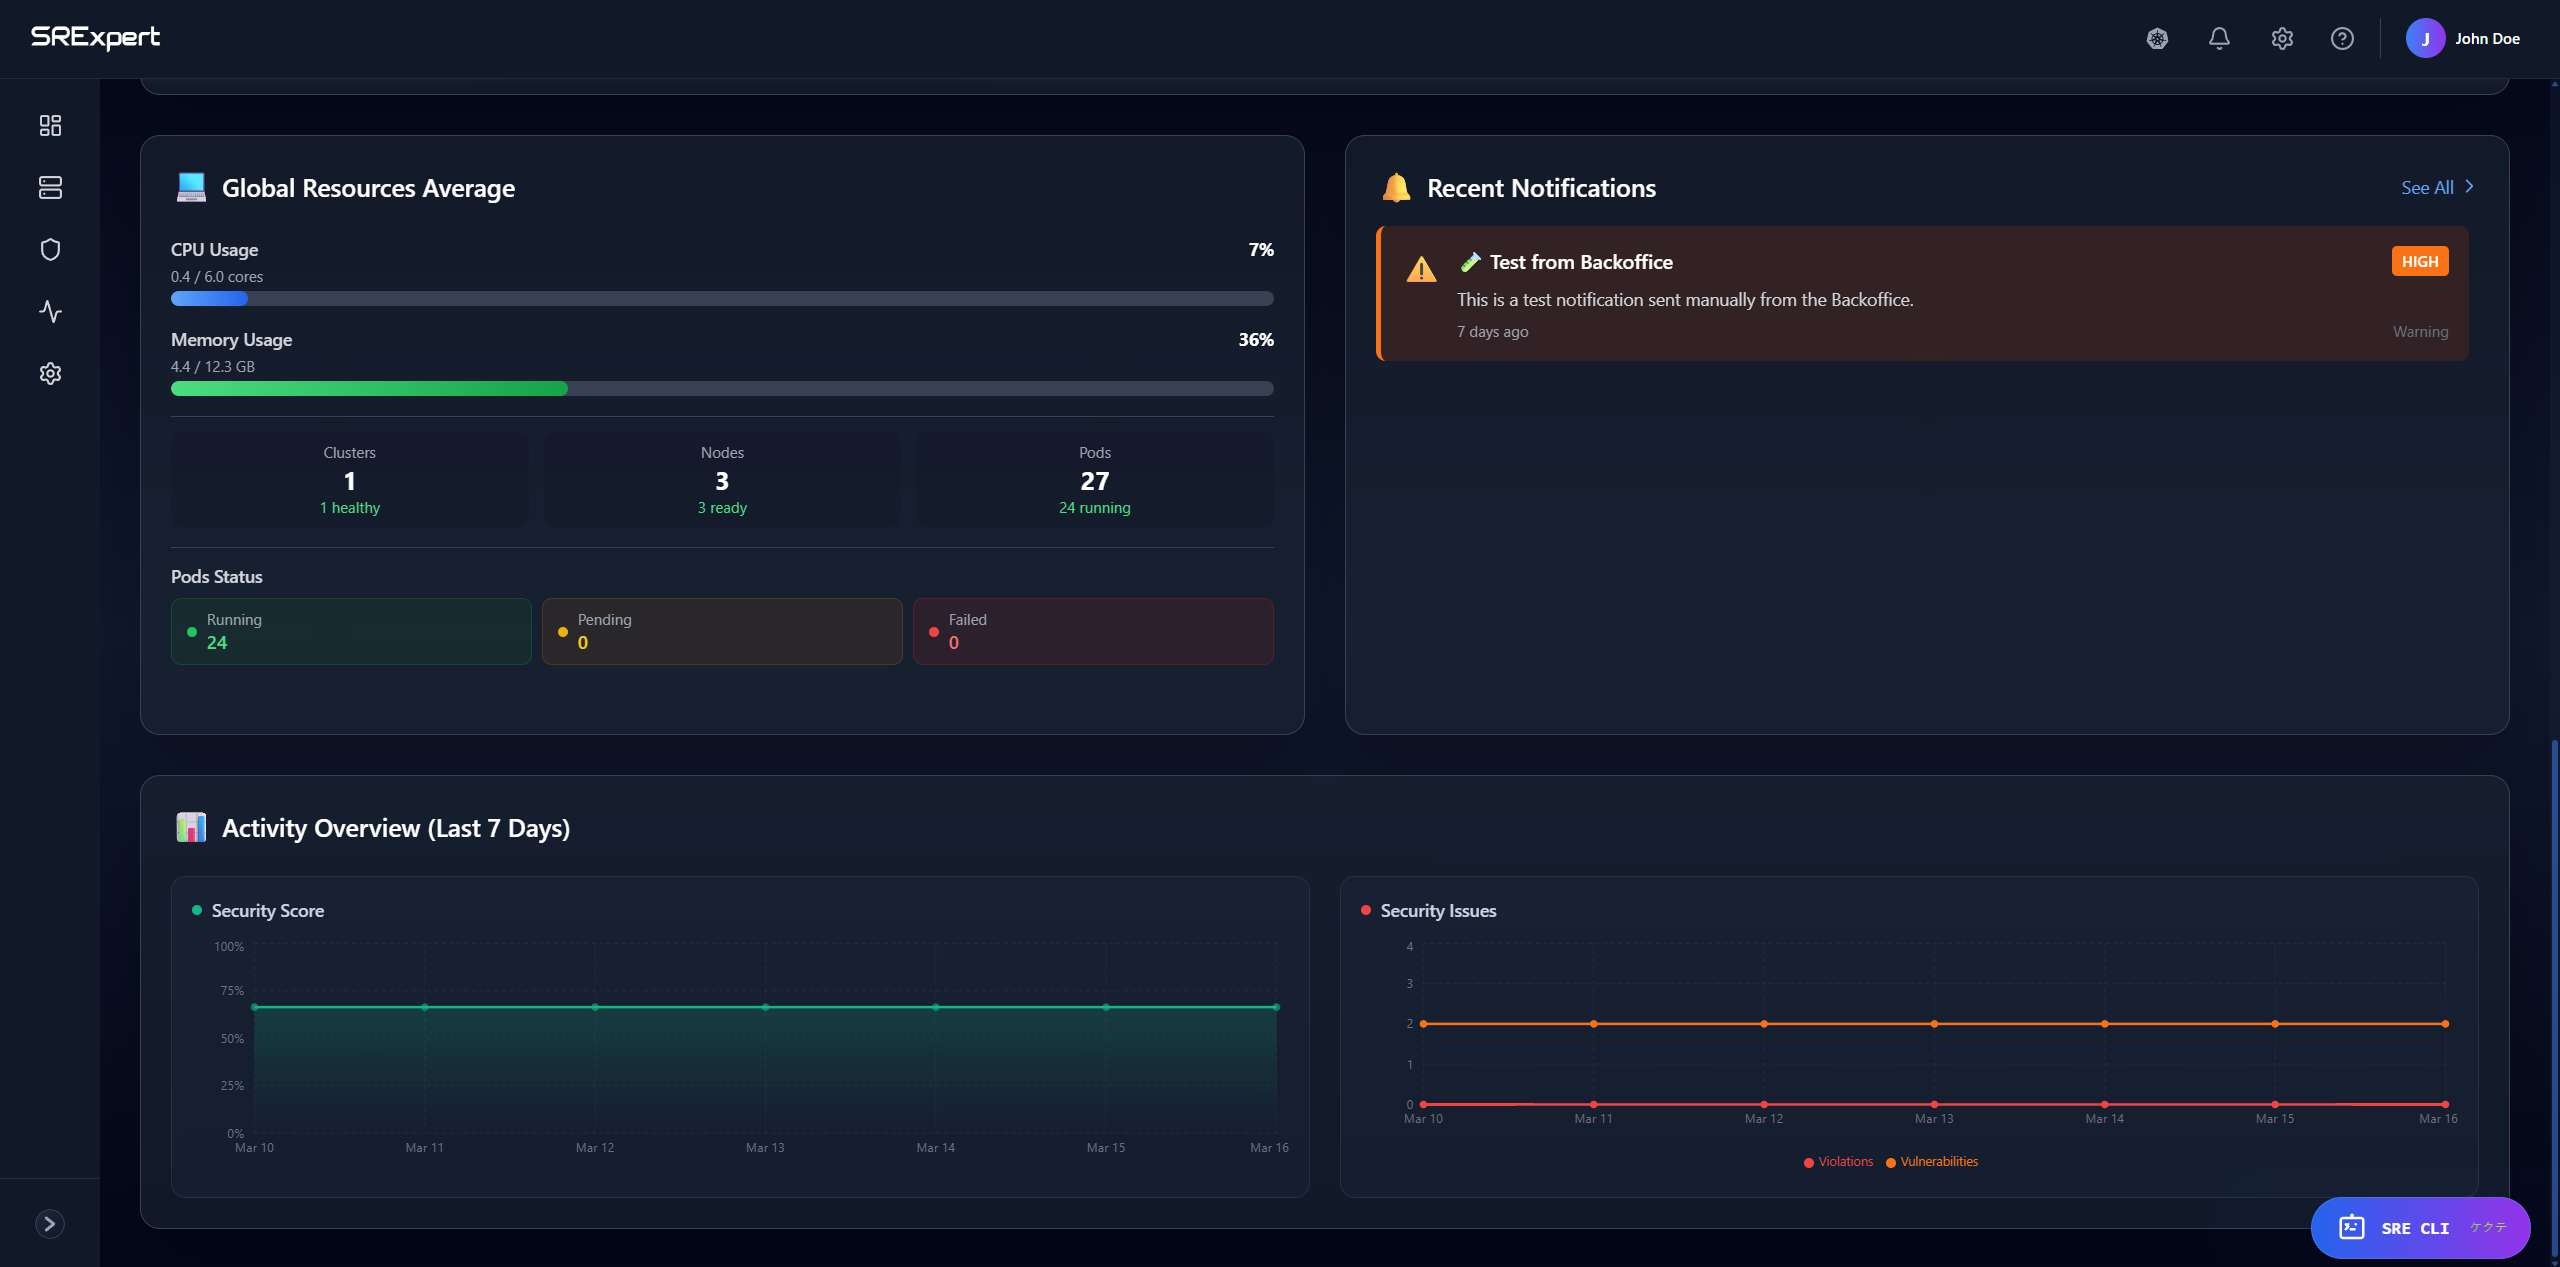
The dashboard shows recent cluster events:
- Warning events
- Error events
- Normal events
Events are sortable by:
- Time
- Type
- Namespace
- Resource
Quick Actions
Common operations accessible from the dashboard:
- Create new workload
- Scale deployment
- View logs
- Open terminal
Navigation
From the dashboard, navigate to:
- Click on any resource to see details
- Use the sidebar for specific views
- Use search to find resources
Next Steps
- Workloads View - Manage your workloads
- Monitoring - Deep dive into metrics
- Security View - Check security status